
Why we started Data Stories
Data is everywhere. It is in the sensors on our streets, the satellites above us, the meters in our homes and the open datasets that public agencies publish every year. Most of it is never seen by the people it describes.
AI has changed what is possible here. Analysing millions of data points, finding patterns across a decade and turning them into something visual used to take a research team months. Today it can be done faster, at larger scale and in a way that anyone can explore.
That is why we are launching Indigma Data Stories: a series where we take open data, look for the insights that matter and present them to the public in a clear, approachable way. No jargon, no paywalls, just the data and what it tells us.
We could not think of a better place to start than the environment. It affects every one of us, every day, whether we notice it or not. So our first story is about something we all share: the air we breathe.
What is NO₂, and why should we care?
Nitrogen dioxide (NO₂) is a gas formed whenever fuel is burned at high temperatures. Car and truck engines, power plants, industrial processes, ships, domestic heating and fires all release it. Because so much of it comes from combustion, it is one of the clearest fingerprints of human activity in the air.
NO₂ is not just a marker. It irritates the airways, can worsen asthma and other respiratory conditions, and long-term exposure is linked to reduced lung function, especially in children and older people. It also contributes to the formation of fine particles and ground-level ozone, two other pollutants with serious health effects.
This is why the World Health Organization recommends that the annual average of NO₂ should not exceed 10 µg/m³. Throughout this story, we use that guideline as our benchmark. It is stricter than the current legal limit in the European Union, which reflects how much the scientific understanding of NO₂’s health impact has grown in recent years.
The data behind the story
The Air We Breathe is built on data from the European Environment Agency (EEA), covering annual NO₂ concentrations across Greece from 2014 to 2024.
Instead of looking only at a handful of monitoring stations, we work with a grid that covers the entire country: 32,851 cells, from the centre of Athens to the smallest Aegean island. This lets us see not just the big cities, but also the rural areas, the mountains and the coastline, where measurements are usually scarce.
We use 2014 as our reference year. Every other year is compared against it, so the map shows how the air has changed since the start of the decade, cell by cell.
For each year and each area, the story shows four key statistics:
- Spatial mean: the average NO₂ concentration across all cells in the area, in µg/m³.
- Change since 2014: how much that average has moved compared with the reference year, in percent and in µg/m³.
- 95th percentile (P95): the level that only the most polluted 5% of cells exceed. It shows what the worst-affected places look like, which an average can hide.
- Cells above 10 µg/m³: the share of the area where the annual NO₂ level is above the WHO guideline.
Together, these numbers tell a more honest story than any single figure. An average can look reassuring while specific neighbourhoods breathe much worse air.
The national picture: reassuring on average, but not everywhere
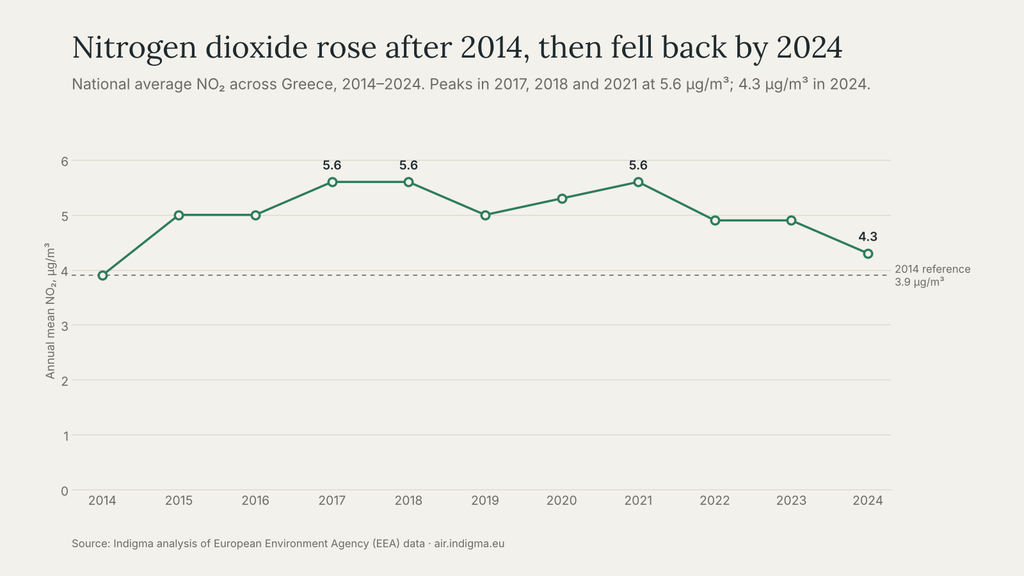
At national level, Greece looks good on paper. Across the whole decade, the country’s average NO₂ concentration stays below the WHO guideline of 10 µg/m³ every single year.
In our reference year, 2014, the national average was 3.9 µg/m³. From there, the levels did not stay still. The highest year of the decade was 2017, when the national average reached 5.6 µg/m³.
The change can be sharp from one year to the next. In 2015, for example:
- the national average rose to 5.0 µg/m³, an increase of +30.1% (+1.2 µg/m³) compared with 2014;
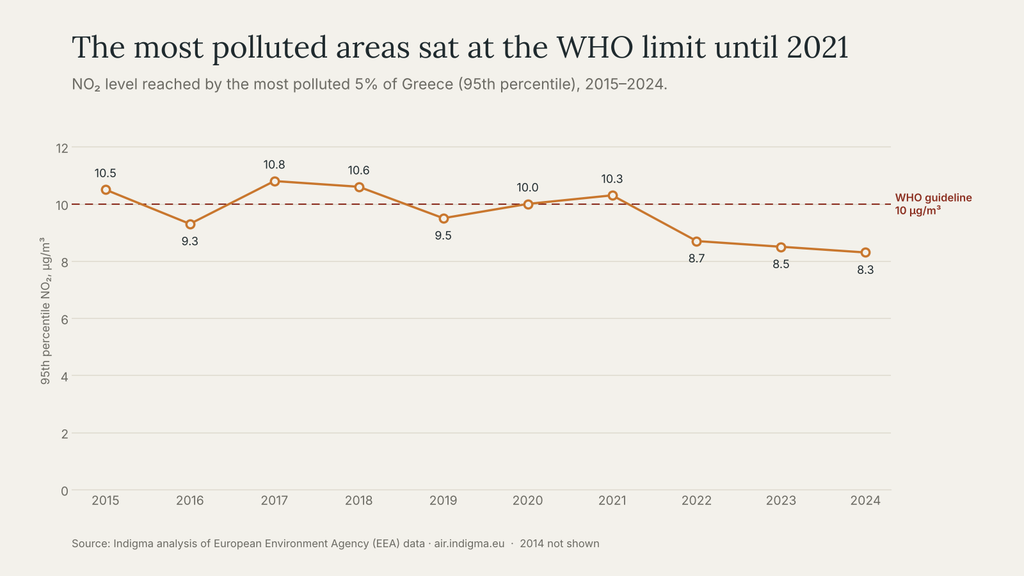
- the most polluted 5% of the country (P95) reached 10.5 µg/m³, above the WHO guideline;
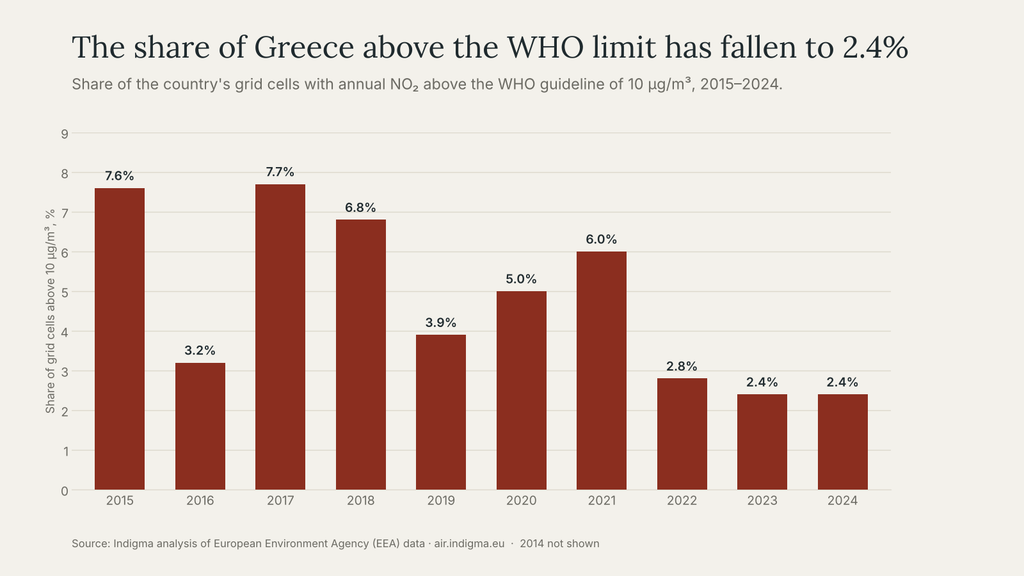
- 7.6% of all grid cells exceeded 10 µg/m³.
This is where the national average starts to mislead. A country-wide figure of 5 µg/m³ sounds comfortable. But behind it, thousands of grid cells, and the people who live in them, are breathing air above the level the WHO considers safe.
Athens and Thessaloniki: above the WHO limit
Zoom into the map and the picture changes. Greece’s two largest cities, Athens and Thessaloniki, have annual NO₂ levels above the WHO guideline of 10 µg/m³.
This is not surprising, but it is important. Together, the two metropolitan areas are home to roughly half of the country’s population. That means a large share of people in Greece live with NO₂ levels that the WHO considers harmful over the long term, even while the national average stays comfortably below the guideline.
It is also a reminder that air quality is deeply local. Two streets in the same city can have very different air, depending on traffic, building density and how well the air can move. A grid of tens of thousands of cells cannot show every street, but it shows clearly where the pressure is highest.
Open question for the Indigma team: add the actual NO₂ values for Athens and Thessaloniki here (and the years they peaked), so readers can see how far above the guideline they are.
What moves the numbers
No single cause explains the map. NO₂ levels rise and fall with a mix of human activity, weather and events, and each leaves its own pattern.
Road traffic. Vehicles, especially diesel engines, are the largest source of NO₂ in most cities. This is the main reason Athens and Thessaloniki stand out so clearly.
Domestic heating. In winter, burning oil, wood and other fuels to heat homes adds to urban and suburban pollution, particularly in colder areas of northern Greece.
Industry and energy. Power plants, refineries and industrial zones create local hotspots that remain visible year after year.
Ports and shipping. Ships burn heavy fuel close to coastal cities. In a country with as much coastline and maritime traffic as Greece, this matters.
Weather. Wind, rain and temperature decide whether pollution disperses or builds up. Two years with the same emissions can look very different on the map.
Economic activity and policy. When the economy slows, traffic and industrial output tend to drop, and so does NO₂. Cleaner vehicle standards and energy policies push in the same direction over time.
Wildfires. This is one of the patterns that surprised us most. In some years, NO₂ rises not only in the cities but across wide rural areas of the mainland and the Peloponnese. Those years appear to coincide with major wildfire seasons. Fires burn huge amounts of biomass and release nitrogen oxides along with smoke, so their effect on air quality can reach far beyond the burned area. What we see is a correlation, not proof of cause, but it is a strong reminder that what happens to our forests ends up in the air we all breathe.
Explore it yourself
The best way to understand the air you breathe is to look at your own area. The interactive map at air.indigma.eu lets you:
- Move through the years and watch how NO₂ changed compared with 2014. Green areas improved, red areas got worse.
- Zoom and drag to any city, village or island in Greece, or use the location button to jump to where you are.
- Click on an area to analyse it and see its own key statistics: average, change since 2014, P95 and share of cells above the WHO guideline.
- Follow the annual trend for 2014–2024, with the lowest and highest year marked and the WHO guideline shown for reference.
- Show or hide the grid to see the data cells on top of the map.
Try your hometown. Then try the place you go on holiday. The differences may surprise you.
Sources
- The Air We Breathe – Indigma, based on European Environment Agency (EEA) NO₂ data, 2014–2024
- WHO Global Air Quality Guidelines (2021): annual NO₂ guideline of 10 µg/m³